Last Updated 13 hours ago by Kenya Engineer
Abstract
Continuous optical analysis can help operators monitor key stages of ethylene dichloride (EDC) production. Ultraviolet-visible spectroscopy can be used to measure residual chlorine and ferric chloride in direct-chlorination effluent, provided the method accounts for overlapping spectral responses. Infrared analysis offers a separate route for measuring water in purified liquid EDC. This article examines where these measurements can be applied, what they can tell plant operators, and why representative sampling, matrix-specific calibration and independent validation are essential to reliable results.
1. Introduction
Ethylene dichloride (EDC) is an important intermediate in the manufacture of vinyl chloride monomer (VCM), which is used to produce polyvinyl chloride (PVC). In an ethylene-based process, EDC is produced through direct chlorination and oxychlorination, then purified and cracked to form VCM and hydrogen chloride. Recovered hydrogen chloride is returned to the oxychlorination stage. Because these operations are connected, changes in stream composition can affect process control, operating performance and product quality. [1]
Three measurements can provide useful information at different points in this process: residual chlorine in the effluent from direct chlorination, ferric chloride in the catalyst-containing liquid, and moisture in purified EDC. Although all three can be monitored using optical techniques, they present different analytical challenges and require different measurement approaches.
2. Where the measurements fit in the process
Direct chlorination combines ethylene and chlorine, commonly using ferric chloride as a catalyst. [1,10] Measuring the chlorine remaining in the reactor effluent can help operators assess reaction performance and the balance between the feeds. Residual chlorine is a key measurement for many plants. An unexpected increase should prompt investigation of operating conditions and the feed or reaction balance rather than being treated as an isolated analyser reading. [6,7]
Ferric chloride is also relevant to the process because it is associated with the catalyst-containing stream and may be important when assessing potential carryover. It is relevant to the measurement itself, too: its optical response can overlap with the response used to quantify chlorine. An analytical method that does not account for this contribution may report an inaccurate chlorine concentration. [2]
Moisture measurement serves a different purpose. Monitoring water in EDC after purification can help identify a decline in drying performance and assess whether the stream meets the requirements for downstream processing. The appropriate alarm limits and acceptable concentrations must be set for the individual plant and its process specification. [4]
Figure 1 shows the conceptual locations of the measurements, distinguishing the direct-chlorination effluent from the purified EDC stream. Actual purification arrangements vary according to the licensed process and plant design.
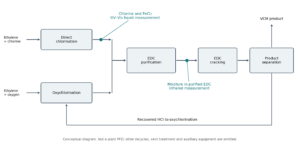
Figure 1. Conceptual EDC/VCM process showing potential optical measurement locations. Purification arrangements vary by licensed process; the diagram is illustrative and is not a plant design.
3. Measuring chlorine and ferric chloride with UV-visible spectroscopy
Chlorine and ferric chloride absorb ultraviolet and visible light. In a flow-through analyser, light passes through a sample held in a cell with a defined optical path length. The instrument compares the transmitted light with a reference measurement to calculate absorbance. Under suitable conditions, absorbance is related to concentration through the Beer–Lambert relationship: A = log₁₀(I₀/I) = εlc. Here, I₀ is the reference intensity, I is the transmitted intensity, ε is absorptivity, l is the optical path length and c is concentration. In practice, the relationship is applied through calibration using representative samples. [3]
Applied Analytics uses this approach in its OMA-300 analyser. A fibre-optic arrangement connects the spectrometer to a dedicated flow cell, keeping the process sample separate from the electronics enclosure. The instrument collects spectral information across a range of wavelengths rather than relying on a single intensity reading. [2]
This broader spectral information is useful when a sample contains more than one absorbing component. A multicomponent calibration can use the different spectral responses of chlorine and ferric chloride to estimate their respective contributions. Where the application and calibration support it, the system can report both concentrations. Even when chlorine is the principal process variable, accounting for ferric chloride may be necessary to obtain a dependable chlorine result.
For operators, the potential benefit is a continuous indication of stream composition between laboratory tests. The same liquid measurement point may provide information on two process components, without requiring a colour-forming reagent to be added to the sample.
Optical measurement nevertheless has limits. High background absorption, changing sample composition or an unsuitable calibration can compromise the chlorine result. The ability to distinguish chlorine from ferric chloride must be demonstrated across the concentration ranges expected in the plant, including credible process excursions. Performance in one EDC stream should not be assumed to transfer to another. Figure 2, reproduced from Applied Analytics’ application note, illustrates overlapping component responses. It is not a calibration curve and does not establish analyser performance at unspecified operating conditions.
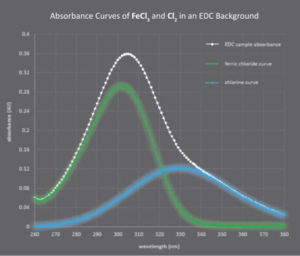
Figure 2. Absorbance spectra in an EDC background, reproduced from Applied Analytics AN-030, p. 7 [2]. The figure illustrates overlapping component responses; concentrations and test conditions are not specified, so it should not be interpreted as a calibration curve.
4. Measuring moisture with infrared analysis
Water absorbs infrared radiation, making it possible to measure moisture optically in a liquid solvent stream. Applied Analytics identifies liquid EDC as an application for its MicroSpec MCP-200 non-dispersive infrared analyser. The optical path and measurement configuration must be selected for the particular application; they are not interchangeable with the arrangement used for chlorine measurement. [4]
A continuous moisture reading can be compared with the plant’s drying and product-quality requirements. It may reveal a developing change between manual laboratory checks and help operators investigate whether the purification system is performing as expected. The analyser can indicate that moisture has changed, but the reading alone cannot identify the cause.
Calibration must account for both the EDC background and the moisture range that the plant needs to measure. A calibration developed for water in another solvent cannot automatically be applied to EDC. Temperature also requires attention: agreement under one ambient condition does not demonstrate accuracy across the range of sample and environmental temperatures encountered in service. Validation should include these conditions, alongside comparisons with an appropriate laboratory reference method.
5. Why selectivity and sample composition matter
The chemical form of iron in the sample also deserves consideration. In a doctoral study of the EDC/iron(III) chloride system, Taylor identified tetrachloroferrate, [FeCl₄]⁻, as the dominant species under the conditions investigated and reported changes following the addition of water or hydrogen chloride. The findings should not be taken to describe every operating plant. They do, however, show why a reported ‘FeCl₃ concentration’ needs a clearly defined analytical basis. Calibration solutions and reference methods should reflect the catalyst chemistry relevant to the process being measured. [10]
Infrared analysis relies on molecular vibrations, rather than the electronic absorption used to measure chlorine and ferric species. Water has fundamental, overtone and combination absorption bands. The useful wavelength region and optical path length depend on the solvent’s transmission characteristics, the required measurement range and the detector configuration. A broad-spectrum instrument and a filter photometer may therefore address the same process objective while using different spectral information. The choice must be appropriate to the solvent and application. [8,9]
A study by Dickens and Dickens, published by the US National Institute of Standards and Technology (NIST), found that the shape and peak intensity of near-infrared water absorption vary with the surrounding hydrogen-bonding environment. The experiments included solvents such as toluene and acetone, but not EDC. The findings reinforce a practical point: water’s infrared response depends on the solvent, so a calibration developed in one liquid cannot be assumed to apply to another. Integrated band area and individual peak height may also respond differently to baseline and spectral-shape changes. [8]
Research by Maczugowska and co-workers is more directly relevant to EDC. The researchers examined water dispersed in chlorinated solvents, including 1,2-dichloroethane, using infrared spectroscopy, molecular-dynamics simulations and density-functional calculations. They related water-cluster populations to solvent polarity and water concentration. The experimental range was 0.005 to 4 wt% water. The study shows that the EDC environment can influence water structure and spectral interpretation; it does not establish an industrial low-parts-per-million calibration or demonstrate the performance of a particular process analyser. [9]
6. Calibration and independent verification
Calibration establishes the relationship between an instrument’s response and concentration under defined conditions. Validation determines whether that relationship is sufficiently reliable for the intended process decision. A zero or span check can test part of the instrument response, but it does not by itself assess the complete sampling system, matrix correction or agreement with a laboratory reference method. These activities should be treated separately in the analytical procedure. [5]
For chlorine and ferric chloride, validation samples should test whether the method can distinguish changes in the two components. If both concentrations always increase or decrease together in the calibration set, a model may fit those samples without reliably separating the analytes. Representative mixtures should therefore include independent variation in chlorine and ferric chloride. Residuals, repeatability and measurement error around important operating limits provide more useful evidence than a correlation coefficient alone. This applies Eurachem’s principles for assessing selectivity and calibration; it is not a report of a new EDC validation trial. [5]
Paired samples should be taken from a point representative of the analyser stream. The sampling time, analyser response delay, concentration basis and temperature should be recorded. Handling and transport must preserve the sample’s original composition so that the laboratory result remains a valid comparison. Validation should cover normal operation and credible changes in moisture, ferric content, chlorine and temperature. If high background absorption makes a result unreliable, the system should flag an invalid measurement rather than displaying a plausible but misleading concentration.
7. Designing the measurement for plant operation
The sample system is part of the measurement, not an accessory to it. Flow, pressure, temperature and transport time all influence the material reaching the optical cell and how quickly the analyser responds to a process change. Materials of construction, containment, isolation and hazardous-area classification must be suitable for the installation. Engineers should also consider maintenance access and how readings will be checked against an independent method.
The measurement basis must be stated clearly. Direct analysis of a liquid and analysis of gas sparged from that liquid are different measurement arrangements. A gas-phase concentration cannot automatically be treated as the concentration in the original EDC stream. Any conversion between the two requires a relationship validated for the specified operating conditions.
Optical monitoring can give operators a more continuous view of important changes in EDC production. Ultraviolet-visible spectroscopy can address chlorine and ferric species in direct-chlorination effluent, while infrared analysis can monitor water in purified EDC. Neither technique removes the need for sound sampling, matrix-specific calibration and independent verification. The value of online measurement ultimately depends on demonstrating that the result is reliable across the conditions in which plant personnel will use it.
References
[1] U.S. EPA. Locating and Estimating Air Emissions from Sources of Ethylene Dichloride. https://www.epa.gov/sites/default/files/2020-11/documents/ethylene_dichloride.pdf
[2] Applied Analytics. Analysis in Vinyl Chloride (VCM) Production Process. AN-030, p. 7. https://aai.solutions/documents/AA_AN030_Analysis-in-VCM-Production-Process.pdf
[3] IUPAC Gold Book. Beer–Lambert law. https://doi.org/10.1351/goldbook.B00626
[4] Applied Analytics. MicroSpec MCP-200 Infrared Analyzer. https://aai.solutions/microspec_mcp-200-infrared-analyzer
[5] Cantwell H. (ed.). Eurachem Guide: The Fitness for Purpose of Analytical Methods. 3rd ed., 2025. https://www.eurachem.org/index.php/publications/guides/mv
[6] Applied Analytics. Critical Analysis Points in the VCM Balanced Process. https://aai.solutions/application-notes/critical-analysis-points-in-the-vcm-balanced-process
[7] Applied Analytics. Measuring FeCl3 and Cl2 in Direct Chlorination Reactor Effluent. https://aai.solutions/application-notes/measuring-fecl3-and-cl2-in-direct-chlorination-reactor-effluent
[8] Dickens B., Dickens S.H. Estimation of Concentration and Bonding Environment of Water Dissolved in Common Solvents Using Near Infrared Absorptivity. J. Res. NIST 104, 173–183 (1999). https://nvlpubs.nist.gov/nistpubs/jres/104/2/html/dickens-n/dickens.htm
[9] Maczugowska P., Zawadzka P., Hałagan K., Pastorczak M., Sadlej J., Kozanecki M. Water clusters in liquid organic matrices of different polarity. J. Mol. Liq. 378, 121580 (2023). https://doi.org/10.1016/j.molliq.2023.121580
[10] Taylor D.S.C. Catalysis in the system 1,2-dichloroethane iron(III) chloride. PhD thesis, University of Glasgow, 2002. https://theses.gla.ac.uk/7015/

-
Product on sale
 AWEBook Volume 2Original price was: KShs 3,500.00.KShs 3,000.00Current price is: KShs 3,000.00.