Last Updated 59 mins ago by Kenya Engineer
Kenya’s electricity demand continued to rise across the country in the financial year ended June 2026, placing renewed attention on the transmission and distribution infrastructure required to deliver power reliably to homes, businesses and industry.
Data published by the Energy and Petroleum Regulatory Authority (EPRA) in its Energy & Petroleum Statistics Report 2026 shows that the Nairobi region consumed 5,465.36 gigawatt-hours (GWh) during the year, equivalent to 43.92 per cent of national electricity consumption. The Coast region followed with 2,087.62 GWh, while North Eastern recorded 1,411.66 GWh.
The figures point to a highly concentrated electricity market, with Nairobi and its surrounding counties accounting for a substantial share of national demand. They also reveal a broader trend: electricity consumption increased across all regions, including areas that account for a relatively small proportion of total usage.
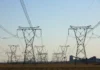
For the electricity sector, this growth has implications beyond generation capacity. Transmission lines, substations and distribution networks must be able to accommodate changing demand while maintaining acceptable voltage levels, limiting technical losses and minimising interruptions.
Nairobi adds more than 500 GWh in a year
Nairobi retained its position as Kenya’s largest electricity-consuming region, with consumption increasing by 10.09 per cent from 4,964.34 GWh in FY 2024/25. The additional 501.02 GWh consumed during the year was greater than the previous year’s total consumption in several of the country’s other electricity regions.
The Nairobi region, as defined in the report, includes Nairobi, Kiambu, Kajiado, Machakos and Makueni counties. Its electricity demand reflects the concentration of commercial activity, manufacturing, residential development and other energy-intensive operations across this urban and peri-urban corridor.
The Coast region ranked second, recording 2,087.62 GWh, an increase of 3.86 per cent from the previous financial year. North Eastern recorded 1,411.66 GWh, representing growth of 14.61 per cent from 1,231.66 GWh.
Central Rift consumed 1,176.45 GWh, up 12.58 per cent from 1,044.91 GWh. The Mt. Kenya region recorded 813.50 GWh, while West Kenya and North Rift registered 655.14 GWh and 574.85 GWh, respectively.
South Nyanza had the lowest reported consumption at 260.12 GWh. However, its growth rate was the highest among the regions.
The regional figures use Kenya Power’s electricity service-area classifications rather than county boundaries alone. The numbers should consequently be interpreted as indicators of demand across utility service regions, not as a direct comparison of consumption by county.
Sondu–Ndhiwa transmission line and the South Nyanza example
South Nyanza recorded year-on-year electricity consumption growth of 17.93 per cent, increasing from 220.49 GWh to 260.12 GWh. EPRA attributed the increase to the commissioning of the Sondu–Ndhiwa Transmission Line, which improved the reliability of electricity supply in the region.
The development provides a useful example of the relationship between network infrastructure and electricity consumption. Improving transmission capacity and supply reliability can help reduce constraints on the delivery of electricity, supporting households, businesses and other users that depend on a more dependable supply.
However, the growth figures alone do not establish how much additional consumption resulted directly from the new line. Demand can also rise because of new connections, population growth, business expansion and increased use of electrical equipment.
The distinction is important when assessing the performance of transmission investments. A project’s benefits may extend beyond the volume of electricity consumed after commissioning to include improved supply quality, reduced congestion and greater scope for new economic activity.
Determining the precise contribution of the Sondu–Ndhiwa line would require more detailed operational data, including changes in interruptions, network loading, losses and the number of new connections served before and after commissioning.
Demand growth extends beyond the main urban centres
The increase in electricity consumption was accompanied by continued expansion of grid connections. EPRA reports that 411,710 new customers were connected during FY 2025/26, bringing the cumulative number of grid-connected customers to 10,432,707.
The number of new connections was higher than the 395,490 recorded in the preceding financial year. While customer growth does not translate directly into an equivalent increase in electricity consumption, it expands the number of users drawing power from the network and adds to the planning requirements facing utilities.
Domestic consumers were a particularly significant source of additional demand. According to figures reported from EPRA’s annual statistics, household electricity consumption increased by 18.87 per cent, rising from 3,640.32 GWh to 4,327.07 GWh. Domestic use accounted for 34.77 per cent of total electricity consumption during the year.
These trends suggest that electricity planning must accommodate both established commercial and industrial loads and the cumulative effect of growing household demand. The latter can change the load profile of distribution networks, particularly in expanding residential areas where new connections may be added faster than local infrastructure is upgraded.
For engineers, the challenge involves matching network investment to the location, timing and characteristics of demand. This requires more than national consumption forecasts: regional load projections, substation capacity assessments, transformer loading and the condition of existing distribution assets are all relevant to decisions on where and when to reinforce the grid.
Generation capacity is only part of the equation
Kenya generated 15,692.81 GWh of electricity during FY 2025/26, while peak electricity demand reached 2,514.28 MW. These figures describe different aspects of the electricity system: annual generation measures energy produced over time, whereas peak demand represents the highest level of power required at a particular moment.
Neither figure, on its own, establishes whether electricity can be delivered reliably to every location on the network.
Adequate generation must be complemented by transmission capacity, distribution infrastructure and effective system operation. Electricity may be available within the wider system while local network constraints limit the amount that can be delivered to a particular area. Conversely, improvements to a constrained network may allow existing generation resources to serve demand more effectively.
As electricity use grows, investment decisions must account for where new loads are emerging, whether substations and transmission corridors have sufficient capacity, and how the network will accommodate future industrial development, urban expansion and changing patterns of household consumption.
The regional data offers a starting point for that assessment. Nairobi’s scale of demand highlights the importance of planning for heavily loaded networks, while the growth recorded in South Nyanza demonstrates why investment in less dominant consumption centres also deserves attention.
The next step is to connect these consumption statistics with more detailed information on network performance, planned transmission projects and the cost of strengthening the grid. That would help establish whether infrastructure investment is keeping pace with demand and where the greatest reliability risks or opportunities for expansion lie.
For Kenya’s electricity sector, the question isn’t just how much power the country can generate. It is also whether the transmission and distribution networks can deliver that power where it is needed, when it is needed, and at the level of reliability required by a growing economy.
Source: Energy and Petroleum Regulatory Authority, Energy & Petroleum Statistics Report 2026, for the financial year ended 30 June 2026.

-
Product on sale
 AWEBook Volume 2Original price was: KShs 3,500.00.KShs 3,000.00Current price is: KShs 3,000.00.